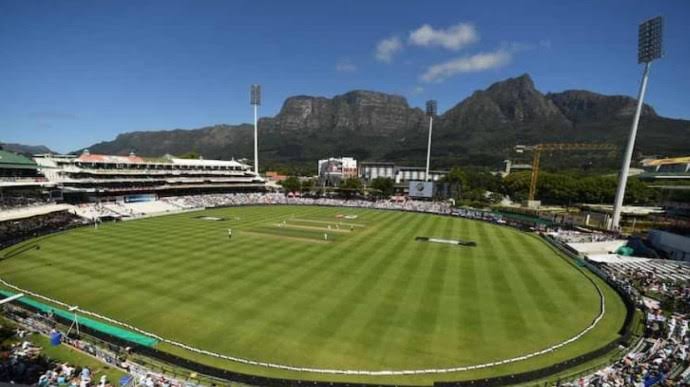
Cape Town Stadium Test Records & Stats- India vs South Africa 2nd Test Today Match 2024
India vs South Africa 2nd Test is going to take place at the Newlands Cricket Ground in Cape Town on 3rd January 2024. The first Test was won by South Africa.
Cape Town Test Records & Stats- India vs South Africa 2nd Test Today Match 2024
Newlands, located in Cape Town, South Africa, has been a historic venue for Test cricket since its first match on 25/03/1889. Over 59 matches played, the home side won 27 times (45.76%), while touring sides claimed victory in 21 matches (35.59%).
Matches won batting first, batting second, winning the toss, and losing the toss were evenly distributed. Notably, the highest individual innings was 262 by S P Fleming (New Zealand) in 2006, and the best bowling figures in an innings (8/11) and match (15/28) were achieved by J Briggs (England) in the inaugural match.
The highest team innings was 651 by South Africa in 2009, while the lowest was 35 in 1899. Australia’s successful run chase of 334/6 in 2002 stands out. The statistical averages provide insights into the competitive nature of matches at Newlands, with an average opening stand of 37.00, runs per wicket at 30.54, runs per over at 2.95, and the average score batting first at 327.
Matches drawn and tied were 11 (18.64%) and 0 (0.00%), respectively. The records encapsulate the rich cricketing history at Newlands up to the last recorded Test match on 11/01/2022.
Also read: Newlands Cricket Ground Test Records & Stats- India vs South Africa 2nd Test Today Match 2024
| City | Cape Town | ||
| Country | South Africa | ||
| First Test Match | 25/03/1889 | ||
| Last Test Match | 11/01/2022 | ||
| Matches Played | 59 | ||
| Matches Won by Home Side | 27 (45.76%) | ||
| Matches Won by Touring Side | 21 (35.59%) | ||
| Matches Won by Neutral Side | 0 (0.00%) | ||
| Matches Won Batting First | 23 (38.98%) | ||
| Matches Won Batting Second | 25 (42.37%) | ||
| Matches Won Winning Toss | 25 (42.37%) | ||
| Matches Won Losing Toss | 23 (38.98%) | ||
| Matches Drawn | 11 (18.64%) | ||
| Matches Tied | 0 (0.00%) | ||
| Highest Individual Innings | 262 | S P Fleming (New Zealand) | 27/04/2006 v South Africa |
| Best Bowling (Innings) | 8/11 | J Briggs (England) | 25/03/1889 v South Africa |
| Best Bowling (Match) | 15/28 | J Briggs (England) | 25/03/1889 v South Africa |
| Highest Team Innings | 651 (South Africa) | 19/03/2009 v Australia | |
| Lowest Team Innings | 35 (South Africa) | 01/04/1899 v England | |
| Highest Run Chase Achieved | 334/6 (Australia) | 08/03/2002 v South Africa | |
| Average Opening Stand (Runs) | 37.00 | ||
| Average Runs per Wicket | 30.54 | ||
| Average Runs per Over | 2.95 | ||
| Average Score Batting First | 327 | ||

