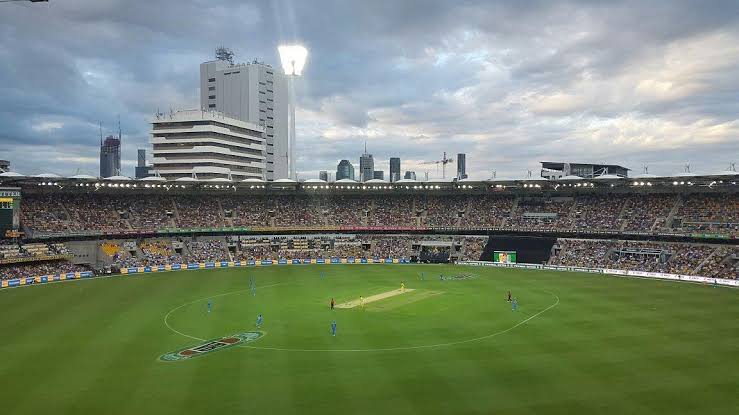
AUS vs WI 2nd Test 2024: The Gabba, Brisbane Pitch Report, Test Records & Stats
Australia vs West Indies 2nd Test is going to be played at the iconic The Gabba Stadium in Brisbane on 25th January 2025.
AUS vs WI 2nd Test 2024: The Gabba, Brisbane Pitch Report
The Gabba’s pitch conditions have remained relatively consistent over the decades, providing significant bounce and pace that pacers appreciate. The upcoming clash between the West Indies and Australia is likely to showcase the Gabba’s natural traits.
Australia’s formidable pace attack, particularly with the skiddy pink ball, poses a threat to the inexperienced West Indies batsmen. Nathan Lyon, the off-spinner, could come into play with his ability to generate overspin and induce bat-pad catches on the bouncy surface. As the Test progresses, the pitch may experience wear and tear, offering the tall Aussie quicks opportunities for unpredictable bounce off the good-length area.
AUS vs WI 2nd Test 2024: The Gabba, Brisbane Test Records & Stats
The Brisbane Cricket Ground, also known as Woolloongabba Ground or The Gabba, situated in Brisbane, Australia, has hosted Test matches since 27/11/1931. With a total of 65 matches played until the last one on 17/12/2022, it boasts a significant home advantage, with the home side winning 64.62% of matches. Matches won batting first and second are evenly distributed at 38.46% and 40.00%, respectively.
The ground has seen notable individual performances, such as Michael Clarke’s impressive 259* against South Africa on 09/11/2012, and Richard Hadlee’s outstanding bowling feats with 9/52 in an innings and 15/123 in a match on 08/11/1985 against Australia.
The highest team innings recorded at the Gabba is 645 by Australia on 29/11/1946 against England. However, it has witnessed low points too, with India and England both being dismissed for 58 on 28/11/1947 and 04/12/1936, respectively.
In terms of run chases, India achieved the highest successful chase of 329/7 on 15/01/2021 against Australia. The statistical averages include an average opening stand of 36.44, average runs per wicket at 32.35, and an average score of 332 when batting first. The ground’s history reflects its significance in Test cricket, capturing memorable moments and showcasing competitive matches over the years.
Also read: India vs England Head to Head Records & Stats in Test Cricket – IND vs ENG 1st Test Match 2024
| City | Brisbane | ||
| Country | Australia | ||
| Also or previously Known as | Woolloongabba Ground, The Gabba | ||
| First Test Match | 27/11/1931 | ||
| Last Test Match | 17/12/2022 | ||
| Matches Played | 65 | ||
| Matches Won by Home Side | 42 (64.62%) | ||
| Matches Won by Touring Side | 9 (13.85%) | ||
| Matches Won by Neutral Side | 0 (0.00%) | ||
| Matches Won Batting First | 25 (38.46%) | ||
| Matches Won Batting Second | 26 (40.00%) | ||
| Matches Won Winning Toss | 27 (41.54%) | ||
| Matches Won Losing Toss | 24 (36.92%) | ||
| Matches Drawn | 13 (20.00%) | ||
| Matches Tied | 1 (1.54%) | ||
| Highest Individual Innings | 259* | M J Clarke (Australia) | 09/11/2012 v South Africa |
| Best Bowling (Innings) | 9/52 | R J Hadlee (New Zealand) | 08/11/1985 v Australia |
| Best Bowling (Match) | 15/123 | R J Hadlee (New Zealand) | 08/11/1985 v Australia |
| Highest Team Innings | 645 (Australia) | 29/11/1946 v England | |
| Lowest Team Innings | 58 (India) 58 (England) | 28/11/1947 v Australia 04/12/1936 v Australia | |
| Highest Run Chase Achieved | 329/7 (India) | 15/01/2021 v Australia | |
| Average Opening Stand (Runs) | 36.44 | ||
| Average Runs per Wicket | 32.35 | ||
| Average Runs per Over | 3.16 | ||
| Average Score Batting First | 332 | ||


