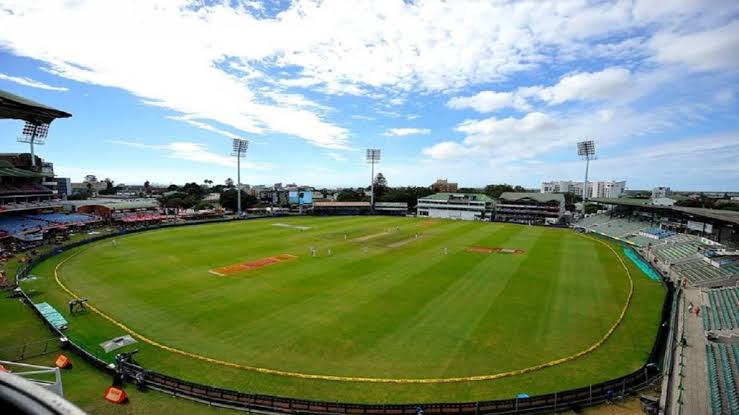
IND vs SA 2nd ODI St George’s Oval Gqeberha Pitch Report Today Match 2023
St George’s Park’s wickets initially favor batsmen, offering them assistance in the early stages of the game. However, as the match progresses, the pitch transforms to provide valuable support to spinners or seam bowlers, adding an additional layer of complexity to the dynamics of play. This evolution in pitch conditions contributes to the strategic challenges faced by teams and enhances the overall unpredictability of matches held at this venue.
IND vs SA 2nd ODI St George’s Oval Gqeberha Avg Score, Highest Total and More Today Match 2023
St George’s Oval Stadium in Gqeberha, Port Elizabeth, South Africa. It has hosted a total of 42 One Day International (ODI) matches, with the first match taking place on 9th December 1992 and the last on 13th March 2019. In these matches, the home side won 21 times (50.00%), the touring side won 13 times (30.95%), and neutral sides emerged victorious in 7 matches (16.67%).
In terms of batting performances, teams won 47.62% of matches when batting first and 50.00% when batting second. The team winning the toss won 45.24% of the matches, while the team losing the toss won 52.38%. There were no tied matches, and only 1 match (2.38%) ended with no result.
The highest individual innings recorded at this venue is 135 runs by Saleem Elahi from Pakistan on 11th December 2002, while the best bowling figures were achieved by A J Bichel from Australia with 7/20 on 2nd March 2003 against England.
The highest team innings was 335/6 by Pakistan on 11th December 2002, while the lowest team innings was 112 by New Zealand on 11th March 2003 against Australia. The highest successful run chase was 330/7 by Australia on 6th April 2002 against South Africa.
On average, there were 29.38 runs scored per wicket, and the run rate was 4.70 runs per over. The average score batting first was 233.
Also read: St George’s Oval Gqeberha ODI Records & Stats- India vs South Africa 2nd ODI Today Match 2023
| City | Port Elizabeth | ||
| Country | South Africa | ||
| Also or previously Known as | St George’s Oval Stadium | ||
| First ODI Match | 09/12/1992 | ||
| Last ODI Match | 13/03/2019 | ||
| Matches Played | 42 | ||
| Matches Won by Home Side | 21 (50.00%) | ||
| Matches Won by Touring Side | 13 (30.95%) | ||
| Matches Won by Neutral Side | 7 (16.67%) | ||
| Matches Won Batting First | 20 (47.62%) | ||
| Matches Won Batting Second | 21 (50.00%) | ||
| Matches Won Winning Toss | 19 (45.24%) | ||
| Matches Won Losing Toss | 22 (52.38%) | ||
| Matches Tied | 0 (0.00%) | ||
| Matches with No Result | 1 (2.38%) | ||
| Highest Individual Innings | 135 | Saleem Elahi (Pakistan) | 11/12/2002 v South Africa |
| Best Bowling | 7/20 | A J Bichel (Australia) | 02/03/2003 v England |
| Highest Team Innings | 335/6 (Pakistan) | 11/12/2002 v South Africa | |
| Lowest Team Innings | 112 (New Zealand) | 11/03/2003 v Australia | |
| Highest Run Chase Achieved | 330/7 (Australia) | 06/04/2002 v South Africa | |
| Average Runs per Wicket | 29.38 | ||
| Average Runs per Over | 4.70 | ||
| Average Score Batting First | 233 | ||

