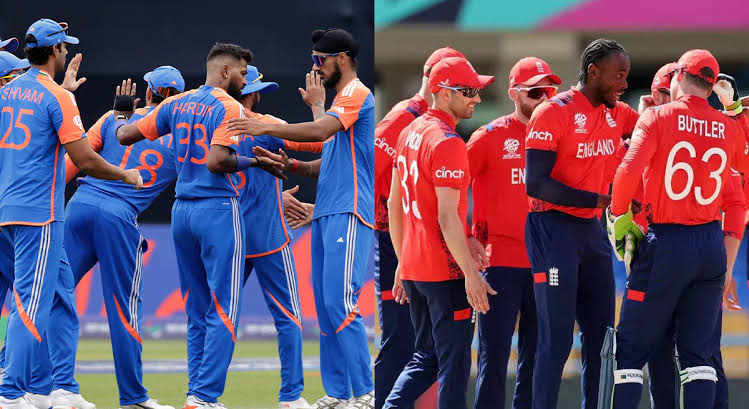
India and England have faced each other 23 times in T20 international matches. India has a slight edge with 12 victories, while England has won 11 matches. There have been no instances of matches ending without a result.
India vs England Head To Head Player Stats in T20s
| Criteria | Player | Stat |
| Most Runs | Virat Kohli (IND) | 647 Runs |
| Most Wickets | Chris Jordan (ENG) | 21 Wickets |
| Highest Score | Suryakumar Yadav (IND) | 117 Runs |
| Best Bowling Figure | Yuzvendra Chahal (IND) | 6/25 |
| Best Strike Rate | Shardul Thakur (IND) | 200.00 |
| Highest Batting Avg | Ravi Bopara (ENG) | 103.00 |
| Best Economy Rate | Yuvraj Singh (IND) | 5.44 |
| Best Bowling Avg | Irfan Pathan (IND) | 8.40 |
In the T20 head-to-head encounters between India and England, several players have distinguished themselves with remarkable performances. Virat Kohli leads the batting charts with 647 runs, demonstrating his consistent run-scoring ability. On the bowling front, Chris Jordan from England has taken the most wickets, with 21 scalps to his name.
Suryakumar Yadav holds the record for the highest individual score, smashing 117 runs in a single innings. Yuzvendra Chahal’s best bowling figure of 6/25 stands out as the top bowling performance. Shardul Thakur boasts the best strike rate at 200.00, while Ravi Bopara maintains the highest batting average of 103.00.
Yuvraj Singh has the best economy rate, conceding just 5.44 runs per over, and Irfan Pathan holds the best bowling average at 8.40, underscoring his effectiveness with the ball.

