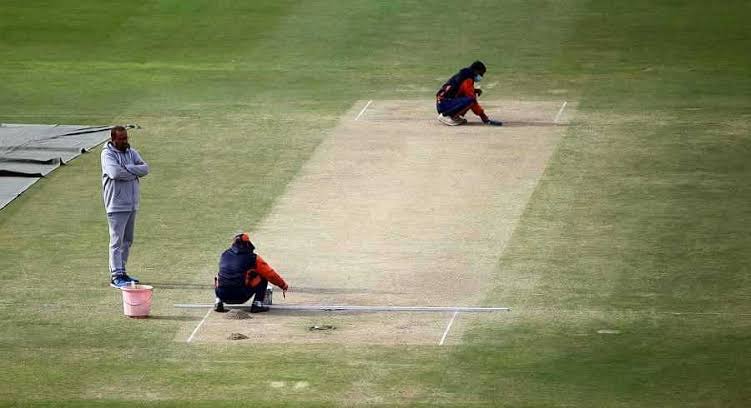
Johannesburg Stadium T20 Records & Stats- India vs South Africa 3rd T20I Today Match 2023
India will face South Africa in the third and final T20I of the three match Series at the New Wanderers Stadium in Johannesburg, South Africa on December 14, 2023. South Africa is in the lead with 1-0 in the series.
Johannesburg Stadium T20 Records & Stats
Wanderers Stadium, located in Johannesburg, South Africa, has also been known as New Wanderers Stadium. It hosted its first T20 match on October 21, 2005, and the most recent one on March 28, 2023. In the 32 matches played, the home side has won 14 times (43.75%), the touring side 10 times (31.25%), and neutral sides 8 times (25.00%).
Batting second has proven advantageous, with teams winning 17 matches (53.13%) compared to 15 matches (46.88%) won by the team batting first. The team winning the toss has won 13 matches (40.63%), while the team losing the toss has secured victory in 19 matches (59.38%).
No matches ended in a tie or with no result. The highest individual innings was scored by F du Plessis with 119 against West Indies on January 11, 2015. The best bowling figures were 5/24 by B Kumar (India) on February 18, 2018, and A C Agar (Australia) on February 21, 2020, both against South Africa.
The highest team innings was 260/6 by Sri Lanka on September 14, 2007, against Kenya, while the lowest team innings was 83 by Bangladesh on September 18, 2007, against Sri Lanka. The highest successful run chase was 236/6 by West Indies on January 11, 2015, against South Africa.
On average, each wicket falls at 25.51 runs, and teams score at an average of 8.66 runs per over. The typical score batting first is 173 runs.
Also read: New Wanderers Stadium T20 Records & Stats- India vs South Africa 3rd T20I Today Match 2023
| City | Johannesburg | ||
| Country | South Africa | ||
| Also or previously Known as | New Wanderers Stadium | ||
| First T20 Match | 21/10/2005 | ||
| Last T20 Match | 28/03/2023 | ||
| Matches Played | 32 | ||
| Matches Won by Home Side | 14 (43.75%) | ||
| Matches Won by Touring Side | 10 (31.25%) | ||
| Matches Won by Neutral Side | 8 (25.00%) | ||
| Matches Won Batting First | 15 (46.88%) | ||
| Matches Won Batting Second | 17 (53.13%) | ||
| Matches Won Winning Toss | 13 (40.63%) | ||
| Matches Won Losing Toss | 19 (59.38%) | ||
| Matches Tied | 0 (0.00%) | ||
| Matches with No Result | 0 (0.00%) | ||
| Highest Individual Innings | 119 | F du Plessis (South Africa) | 11/01/2015 v West Indies |
| Best Bowling | 5/24 5/24 | B Kumar (India) A C Agar (Australia) | 18/02/2018 v South Africa 21/02/2020 v South Africa |
| Highest Team Innings | 260/6 (Sri Lanka) | 14/09/2007 v Kenya | |
| Lowest Team Innings | 83 (Bangladesh) | 18/09/2007 v Sri Lanka | |
| Highest Run Chase Achieved | 236/6 (West Indies) | 11/01/2015 v South Africa | |
| Average Runs per Wicket | 25.51 | ||
| Average Runs per Over | 8.66 | ||
| Average Score Batting First | 173 | ||

