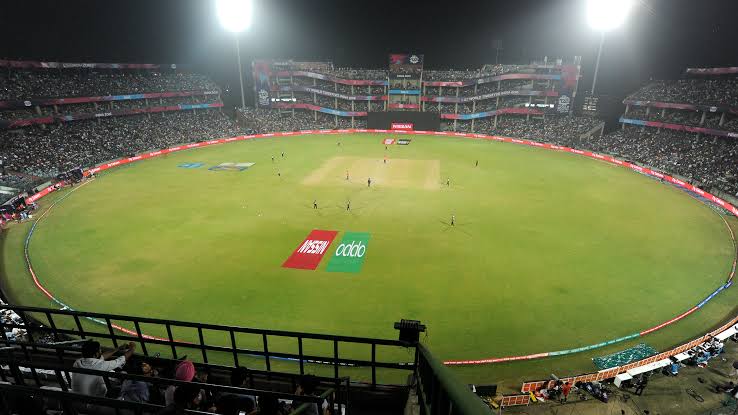
Delhi Stadium ODI Records & Stats- Australia vs Netherlands World Cup 2023
The cricket stadium located in Delhi, India, also known as Feroz Shah Kotla, has a rich history in One Day International (ODI) matches. Since its first ODI match on September 15, 1982, there have been a total of 29 matches played at this venue. In terms of performance, the home side won 14 matches (48.28%), the touring side won 7 matches (24.14%), and neutral sides also won 7 matches (24.14%).
Matches were fairly evenly distributed between batting first and second, with 14 wins for each (48.28% each). When it comes to winning the toss, the home side won 11 matches (37.93%), and the losing side won 17 matches (58.62%), with no tied matches and just one with no result.
The highest individual innings at this venue was an impressive 145 runs by R T Ponting from Australia on April 11, 1998, against Zimbabwe. The best bowling performance was by K A J Roach from the West Indies, who took 6 wickets for 27 runs on February 28, 2011, against the Netherlands.
The highest team innings recorded here was 428/5 by South Africa on October 7, 2023, against Sri Lanka, while the lowest team innings was 99 runs by South Africa on October 11, 2022, against India. The highest successful run chase achieved at this venue was 281/4 by Sri Lanka on September 15, 1982, against India.
On average, 31.18 runs were scored per wicket, and the average runs per over were 5.05. The average score for the team batting first was 240 runs. This information provides insights into the historical ODI performances at the Feroz Shah Kotla cricket stadium in Delhi, India.
Also read: Arun Jaitley Stadium ODI Records & Stats- Australia vs Netherlands World Cup 2023
| City | Delhi | ||
| Country | India | ||
| Also or previously Known as | Feroz Shah Kotla | ||
| First ODI Match | 15/09/1982 | ||
| Last ODI Match | 15/10/2023 | ||
| Matches Played | 29 | ||
| Matches Won by Home Side | 14 (48.28%) | ||
| Matches Won by Touring Side | 7 (24.14%) | ||
| Matches Won by Neutral Side | 7 (24.14%) | ||
| Matches Won Batting First | 14 (48.28%) | ||
| Matches Won Batting Second | 14 (48.28%) | ||
| Matches Won Winning Toss | 11 (37.93%) | ||
| Matches Won Losing Toss | 17 (58.62%) | ||
| Matches Tied | 0 (0.00%) | ||
| Matches with No Result | 1 (3.45%) | ||
| Highest Individual Innings | 145 | R T Ponting (Australia) | 11/04/1998 v Zimbabwe |
| Best Bowling | 6/27 | K A J Roach (West Indies) | 28/02/2011 v Netherlands |
| Highest Team Innings | 428/5 (South Africa) | 07/10/2023 v Sri Lanka | |
| Lowest Team Innings | 99 (South Africa) | 11/10/2022 v India | |
| Highest Run Chase Achieved | 281/4 (Sri Lanka) | 15/09/1982 v India | |
| Average Runs per Wicket | 31.18 | ||
| Average Runs per Over | 5.05 | ||
| Average Score Batting First | 240 | ||

