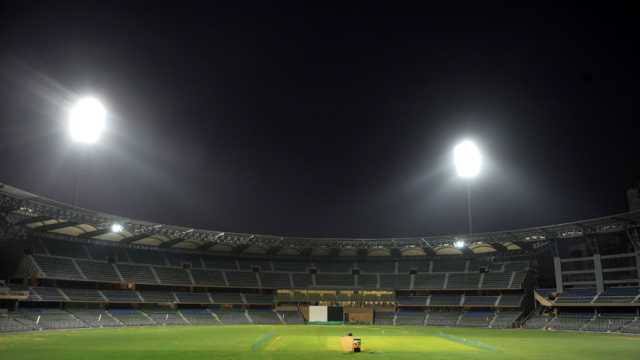
IND vs NZ Semi-Final: Wankhede Stadium ODI Records & Stats World Cup 2023
Wankhede Stadium in Mumbai, India, has hosted a total of 27 One Day International (ODI) cricket matches, with its inaugural ODI taking place on January 17, 1987, and the most recent match occurring on November 7, 2023. In these encounters, the home side emerged victorious in 12 matches, constituting a win percentage of 44.44%, while the touring side claimed success in 9 matches, equivalent to a 33.33% win rate. Additionally, matches played at this venue resulted in a 22.22% win rate for the neutral side.
Teams batting first won 14 matches (51.85%), showcasing a slight advantage, while teams chasing down a target secured victory in 13 matches (48.15%). Interestingly, winning the toss did not significantly tilt the odds, as the home side triumphed in 12 matches after winning the toss (44.44%), while 15 matches were won by the side losing the toss (55.56%).
Notably, there were no tied matches or encounters with no result. The highest individual innings recorded at the venue was an impressive 201* by G J Maxwell of Australia on November 7, 2023, against Afghanistan. M Kartik’s bowling performance of 6/27 for India on October 17, 2007, against Australia stands as the best bowling figures at the venue.
In terms of team achievements, the highest team innings at the Wankhede Stadium was posted by South Africa, scoring 438/4 on October 25, 2015, against India. On the flip side, Sri Lanka faced a challenging outing, registering the lowest team innings with a score of 55 on November 2, 2023, against India.
The most recent statistical highlight was Australia’s successful run chase of 293/7 on November 7, 2023, against Afghanistan. Overall, the Wankhede Stadium has seen an average of 31.89 runs per wicket, 5.28 runs per over, and an average score of 261 when batting first. These numbers collectively paint a vivid picture of the cricketing history and dynamics at this iconic venue.
Also read: India vs New Zealand Semi Final Wankhede Stadium Pitch Report ODI World Cup 2023
| City | Mumbai | ||
| Country | India | ||
| First ODI Match | 17/01/1987 | ||
| Last ODI Match | 07/11/2023 | ||
| Matches Played | 27 | ||
| Matches Won by Home Side | 12 (44.44%) | ||
| Matches Won by Touring Side | 9 (33.33%) | ||
| Matches Won by Neutral Side | 6 (22.22%) | ||
| Matches Won Batting First | 14 (51.85%) | ||
| Matches Won Batting Second | 13 (48.15%) | ||
| Matches Won Winning Toss | 12 (44.44%) | ||
| Matches Won Losing Toss | 15 (55.56%) | ||
| Matches Tied | 0 (0.00%) | ||
| Matches with No Result | 0 (0.00%) | ||
| Highest Individual Innings | 201* | G J Maxwell (Australia) | 07/11/2023 v Afghanistan |
| Best Bowling | 6/27 | M Kartik (India) | 17/10/2007 v Australia |
| Highest Team Innings | 438/4 (South Africa) | 25/10/2015 v India | |
| Lowest Team Innings | 55 (Sri Lanka) | 02/11/2023 v India | |
| Highest Run Chase Achieved | 293/7 (Australia) | 07/11/2023 v Afghanistan | |
| Average Runs per Wicket | 31.89 | ||
| Average Runs per Over | 5.28 | ||
| Average Score Batting First | 261 | ||

