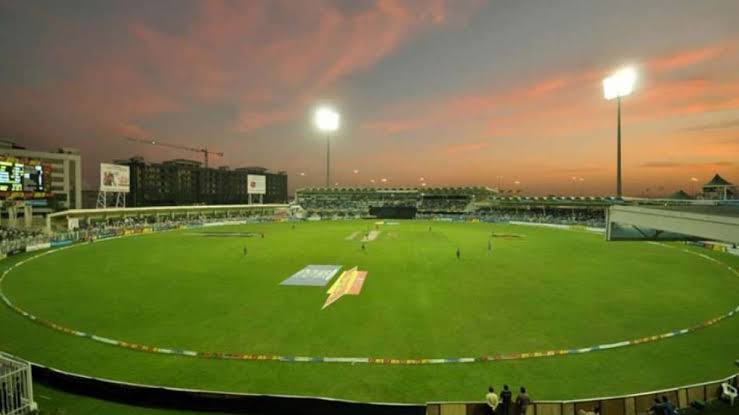
AFG vs IRE 1st ODI 2024: Sharjah Cricket Stadium ODI Records & Stats are covered here. Check out the ODI Stats of Sharjah Cricket Stadium before the start of Afghanistan vs Ireland 1st ODI 2024 on 5:30 PM IST.
Table of Contents
Sharjah Cricket Stadium ODI Records & Stats
- Location: Sharjah, United Arab Emirates.
- ODI History:
- First ODI Match: April 6, 1984.
- Last ODI Match: June 9, 2023.
- Total Matches Played: 247.
- Match Results:
- Matches Won by Home Side: 2 (0.81%).
- Matches Won by Touring Side: 6 (2.43%).
- Matches Won by Neutral Side: 237 (95.95%).
- Match Outcomes by Batting Order:
- Matches Won Batting First: 130 (52.42%).
- Matches Won Batting Second: 115 (46.37%).
- Toss Influence:
- Matches Won Winning Toss: 119 (47.98%).
- Matches Won Losing Toss: 126 (50.81%).
- Other Statistics:
- Matches Tied: 2 (0.81%).
- Matches with No Result: 0 (0.00%).
- Highest Individual Innings: 189 by S T Jayasuriya (Sri Lanka) on October 29, 2000, against India.
- Best Bowling Figures: 7/30 by M Muralitharan (Sri Lanka) on October 27, 2000, against India.
- Highest Team Innings: 364/7 by Pakistan on December 14, 2014, against New Zealand.
- Lowest Team Innings: 54 by India on October 29, 2000, against Sri Lanka.
- Highest Run Chase Achieved: 285/2 by Australia on March 23, 2019, against Pakistan.
- Average Performance:
- Average Runs per Wicket: 28.37.
- Average Runs per Over: 4.58.
- Average Score Batting First: 224.
| City | Sharjah | ||
| Country | United Arab Emirates | ||
| First ODI Match | 06/04/1984 | ||
| Last ODI Match | 09/06/2023 | ||
| Matches Played | 247 | ||
| Matches Won by Home Side | 2 (0.81%) | ||
| Matches Won by Touring Side | 6 (2.43%) | ||
| Matches Won by Neutral Side | 237 (95.95%) | ||
| Matches Won Batting First | 130 (52.42%) | ||
| Matches Won Batting Second | 115 (46.37%) | ||
| Matches Won Winning Toss | 119 (47.98%) | ||
| Matches Won Losing Toss | 126 (50.81%) | ||
| Matches Tied | 2 (0.81%) | ||
| Matches with No Result | 0 (0.00%) | ||
| Highest Individual Innings | 189 | S T Jayasuriya (Sri Lanka) | 29/10/2000 v India |
| Best Bowling | 7/30 | M Muralitharan (Sri Lanka) | 27/10/2000 v India |
| Highest Team Innings | 364/7 (Pakistan) | 14/12/2014 v New Zealand | |
| Lowest Team Innings | 54 (India) | 29/10/2000 v Sri Lanka | |
| Highest Run Chase Achieved | 285/2 (Australia) | 23/03/2019 v Pakistan | |
| Average Runs per Wicket | 28.37 | ||
| Average Runs per Over | 4.58 | ||
| Average Score Batting First | 224 | ||
Also read: IND vs ENG 5th Test 2024: Dharamshala Stadium Test Records & Stats
Sharjah Cricket Stadium Pitch Report
Sharjah Cricket Stadium has a sluggish pitch that gets slower as time passes. Spinners will play a big role in the match. Even the pacers are going to be hard to hit on at this venue. Anything above 225 is going to be highly competitive at this pitch.

