AUS vs WI 3rd T20 2024: Perth Stadium Pitch Report and T20 Records & Stats
Australia and the West Indies are set to face off in their third T20 match on Tuesday, wrapping up an eventful summer of cricket between the two teams. Following a split Test series, Australia dominated the ODI series and secured a crucial T20 victory in Adelaide. Can they end the summer on a high note with another win? The Aussies are expected to make two changes to the lineup that triumphed in Adelaide, with Josh Hazlewood and Marcus Stoinis likely to be rested in preparation for the upcoming tour of New Zealand. Xavier Bartlett and Aaron Hardie are poised to step in and showcase their skills.
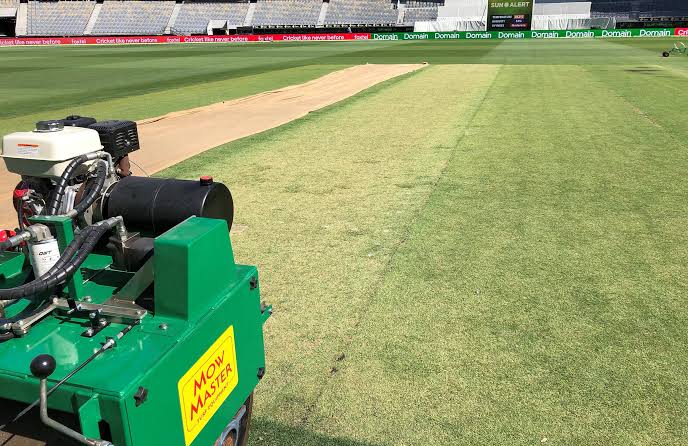
AUS vs WI 3rd T20 2024: Perth Stadium Pitch Report Today Match
Perth stands out as Australia’s swiftest wicket, offering remarkable pace and bounce ideal for fast bowlers to exploit. This unique characteristic favors bowlers who can generate extra zip off the pitch. Additionally, the pitch’s true nature benefits batsmen proficient in playing off the backfoot, enabling them to comfortably dispatch shots square of the wicket.
AUS vs WI 3rd T20 2024: Perth Stadium T20 Records & Stats
Perth Stadium, also known as Optus Stadium, has hosted 7 T20 International matches between November 8, 2019, and October 30, 2022. The home side has won 2 matches (28.57%), while the touring side has won 1 match (14.29%).
Neutral teams have triumphed in 4 matches (57.14%). Matches won batting first account for 28.57%, while those won batting second make up 71.43%. Teams winning the toss have won 57.14% of the matches, while those losing the toss have won 42.86%.
There have been no tied matches or matches with no result. The highest individual innings was scored by A D Hales of England, with 84 runs on October 9, 2022, against Australia. The best bowling performance was by S M Curran of England, with figures of 5/10 on October 22, 2022, against Afghanistan.
The highest team innings was 208/6 by England on October 9, 2022, against Australia, while the lowest team innings was 112 by Afghanistan on October 22, 2022, against England. The highest successful run chase achieved was 158/3 by Australia on October 25, 2022, against Sri Lanka. On average, there have been 20.87 runs scored per wicket and 7.23 runs per over. The average score batting first is 134 runs.
Also read: AUS vs WI Head To Head T20 Records & Stats- Australia vs West Indies 2nd T20 Today Match 2024
| City | Perth | ||
| Country | Australia | ||
| Also or previously Known as | Optus Stadium | ||
| First T20 Match | 08/11/2019 | ||
| Last T20 Match | 30/10/2022 | ||
| Matches Played | 7 | ||
| Matches Won by Home Side | 2 (28.57%) | ||
| Matches Won by Touring Side | 1 (14.29%) | ||
| Matches Won by Neutral Side | 4 (57.14%) | ||
| Matches Won Batting First | 2 (28.57%) | ||
| Matches Won Batting Second | 5 (71.43%) | ||
| Matches Won Winning Toss | 4 (57.14%) | ||
| Matches Won Losing Toss | 3 (42.86%) | ||
| Matches Tied | 0 (0.00%) | ||
| Matches with No Result | 0 (0.00%) | ||
| Highest Individual Innings | 84 | A D Hales (England) | 09/10/2022 v Australia |
| Best Bowling | 5/10 | S M Curran (England) | 22/10/2022 v Afghanistan |
| Highest Team Innings | 208/6 (England) | 09/10/2022 v Australia | |
| Lowest Team Innings | 112 (Afghanistan) | 22/10/2022 v England | |
| Highest Run Chase Achieved | 158/3 (Australia) | 25/10/2022 v Sri Lanka | |
| Average Runs per Wicket | 20.87 | ||
| Average Runs per Over | 7.23 | ||
| Average Score Batting First | 134 | ||

