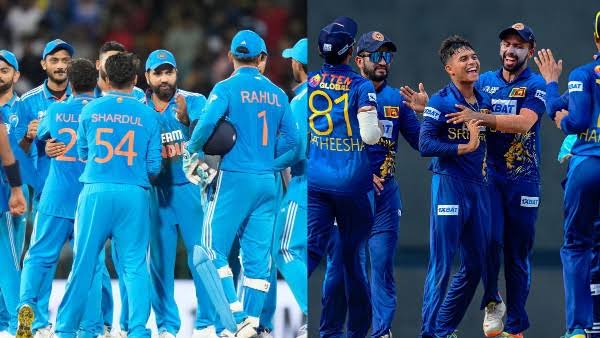
India will face Sri Lanka at the Wankhede Stadium in Mumbai on 2nd November 2023. If India wins this match it will qualify for the World Cup 2023 semi-final. On the other hand, Sri Lanka needs to win all of their remaining games to stand a chance at qualifying for the semi-finals.

IND vs SL, CWC23: Wankhede Stadium ODI Records & Stats
Wankhede Stadium, Mumbai, India, has hosted 25 One Day International (ODI) matches in cricket. These matches were played between January 17, 1987, and October 24, 2023. In these ODIs, the home side won 11 matches (44.00%), the touring side won 9 matches (36.00%), and there were 5 matches (20.00%) with a neutral side winning.
Batting first, teams won 13 matches (52.00%), while teams chasing won 12 matches (48.00%). The side winning the toss won 12 matches (48.00%), and the side losing the toss won 13 matches (52.00%). There were no tied matches or matches with no result.
The highest individual innings in these matches was 174 runs, scored by Q de Kock from South Africa on October 24, 2023, against Bangladesh. The best bowling performance was 6/27 by M Kartik from India on October 17, 2007, against Australia.
The highest team innings was 438/4, achieved by South Africa on October 25, 2015, against India, while the lowest team innings was 115, scored by Bangladesh on May 25, 1998, against India. The highest successful run chase was 284/4, achieved by New Zealand on October 22, 2017, against India.
On average, there were 31.78 runs scored per wicket in these matches, and the average runs scored per over was 5.23. The average score when batting first was 256 runs.
Also read: ICC ODI World Cup 2023: New Zealand vs South Africa Top 3 Players Expected to Perform in Today Match
| City | Mumbai | ||
| Country | India | ||
| First ODI Match | 17/01/1987 | ||
| Last ODI Match | 24/10/2023 | ||
| Matches Played | 25 | ||
| Matches Won by Home Side | 11 (44.00%) | ||
| Matches Won by Touring Side | 9 (36.00%) | ||
| Matches Won by Neutral Side | 5 (20.00%) | ||
| Matches Won Batting First | 13 (52.00%) | ||
| Matches Won Batting Second | 12 (48.00%) | ||
| Matches Won Winning Toss | 12 (48.00%) | ||
| Matches Won Losing Toss | 13 (52.00%) | ||
| Matches Tied | 0 (0.00%) | ||
| Matches with No Result | 0 (0.00%) | ||
| Highest Individual Innings | 174 | Q de Kock (South Africa) | 24/10/2023 v Bangladesh |
| Best Bowling | 6/27 | M Kartik (India) | 17/10/2007 v Australia |
| Highest Team Innings | 438/4 (South Africa) | 25/10/2015 v India | |
| Lowest Team Innings | 115 (Bangladesh) | 25/05/1998 v India | |
| Highest Run Chase Achieved | 284/4 (New Zealand) | 22/10/2017 v India | |
| Average Runs per Wicket | 31.78 | ||
| Average Runs per Over | 5.23 | ||
| Average Score Batting First | 256 | ||

