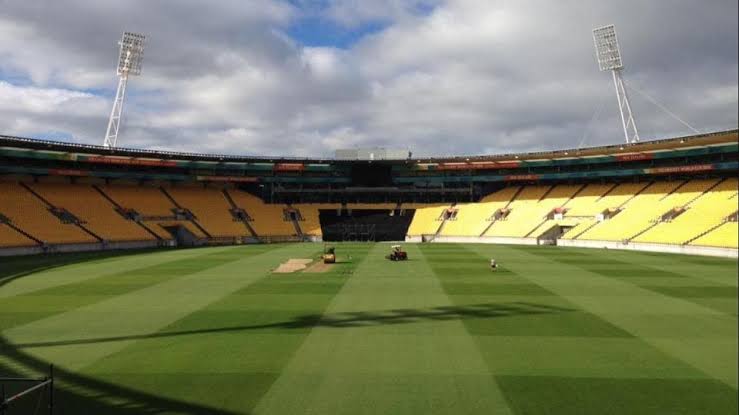
NZ vs AUS 1st T20 2024: Sky Stadium Pitch Report, T20 Records & Stats
New Zealand vs Australia 1st T20I of the Australia Tour of New Zealand 2024 is scheduled to be played at the Sky Stadium on 21 February 2024. Mitchell Santner will captain the Blackcaps while Mitchell Marsh will captain the Kangaroos. Notably, Kane Williamson is not part of the Kiwi squad.
NZ vs AUS 1st T20 2024: Sky Stadium Pitch Report Today Match
Like many venues in New Zealand, Sky Stadium features drop-in pitches. Typically, the average 1st innings score here is around 154, but it often decreases to around 130 in the 2nd innings. While the pitch may slow down slightly as the match progresses, it generally remains favorable for batting. This trend is expected to continue in the upcoming 1st T20I match.
NZ vs AUS 1st T20 2024: Sky Stadium T20 Records & Stats
Sky Stadium, situated in Wellington, New Zealand, has hosted 15 T20 international matches. Formerly known as Westpac Trust Stadium and Westpac Stadium, its inaugural T20 match took place on December 22, 2006, with the last match being held on March 7, 2021.
The home side has emerged victorious in 9 matches (60.00%), while visiting teams have won 6 matches (40.00%). There have been no wins by neutral sides. Matches won while batting first stand at 7 (43.75%), while those won while chasing amount to 8 (50.00%).
Teams winning the toss have won 5 matches (31.25%), whereas those losing the toss have won 10 matches (62.50%). There have been no tied matches or matches with no result.
The highest individual innings was scored by T L Seifert from New Zealand, who made 84 runs against India on February 6, 2019. The best bowling figures were recorded by A C Agar from Australia, who took 6 wickets for 30 runs against New Zealand on March 3, 2021.
The highest team innings was 219/6, achieved by New Zealand against India on February 6, 2019, while the lowest team innings was 101, scored by Pakistan against New Zealand on January 22, 2016.
The highest successful run chase was 163/6 by New Zealand against West Indies on January 15, 2014. On average, each wicket fell at 22.90 runs, with an average of 8.04 runs per over. The average score while batting first was 152 runs.
Also read: NZ vs AUS 1st T20 2024: Wellington Regional Stadium Pitch Report, T20 Records & Stats
| City | Wellington | ||
| Country | New Zealand | ||
| Also or previously Known as | Westpac Trust Stadium, Westpac Stadium | ||
| First T20 Match | 22/12/2006 | ||
| Last T20 Match | 07/03/2021 | ||
| Matches Played | 15 | ||
| Matches Won by Home Side | 9 (60.00%) | ||
| Matches Won by Touring Side | 6 (40.00%) | ||
| Matches Won by Neutral Side | 0 (0.00%) | ||
| Matches Won Batting First | 7 (43.75%) | ||
| Matches Won Batting Second | 8 (50.00%) | ||
| Matches Won Winning Toss | 5 (31.25%) | ||
| Matches Won Losing Toss | 10 (62.50%) | ||
| Matches Tied | 0 (0.00%) | ||
| Matches with No Result | 0 (0.00%) | ||
| Highest Individual Innings | 84 | T L Seifert (New Zealand) | 06/02/2019 v India |
| Best Bowling | 6/30 | A C Agar (Australia) | 03/03/2021 v New Zealand |
| Highest Team Innings | 219/6 (New Zealand) | 06/02/2019 v India | |
| Lowest Team Innings | 101 (Pakistan) | 22/01/2016 v New Zealand | |
| Highest Run Chase Achieved | 163/6 (New Zealand) | 15/01/2014 v West Indies | |
| Average Runs per Wicket | 22.90 | ||
| Average Runs per Over | 8.04 | ||
| Average Score Batting First | 152 | ||

