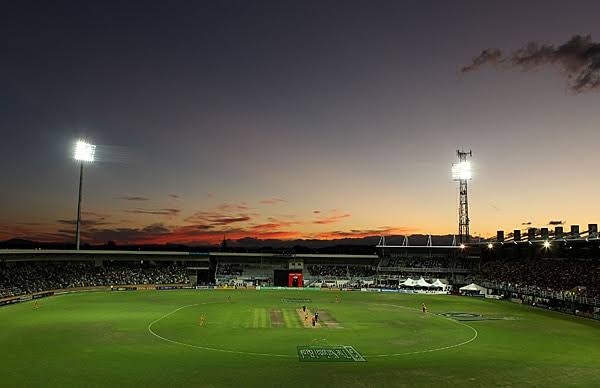
NZ vs BAN 3rd ODI McLean Park Napier Pitch Report Today Match 2023
Napier’s cricket pitch is renowned for its batting-friendly nature, making it a highly favorable wicket for limited-overs cricket. It stands out as one of the world’s premier grounds for high-scoring matches, consistently providing an environment conducive to impressive run totals. The reputation of this venue underscores its significance as a preferred location for batsmen, contributing to its status as one of the top-scoring grounds globally in contemporary cricket.
NZ vs BAN 3rd ODI McLean Park Napier Avg Score, Highest Total and More Today Match 2023
Napier, located in New Zealand, has hosted 44 One Day International (ODI) cricket matches. The first ODI took place on 19/03/1983, while the most recent occurred on 13/02/2019. In these matches, the home side won 25 times (56.82%), the touring side emerged victorious in 14 (31.82%), and neutral teams won twice (4.55%). Batting second proved successful in 51.06% of matches, while batting first resulted in victory 36.17% of the time. Winning the toss was associated with success in 46.81% of cases.
There were 2 tied matches (4.55%) and 1 with no result (2.27%). The highest individual innings was 141* by R T Ponting (Australia) on 05/03/2005. The best bowling performance was 5/30 by M Muralitharan (Sri Lanka) on 31/01/2001. The highest team innings was 373/8 by New Zealand on 09/02/2012, while the lowest was 126 by Pakistan on 14/01/2004. The highest successful run chase was 289/3 by Sri Lanka on 28/12/2006.
The average runs per wicket were 31.44, and the average runs per over were 5.01. The typical score batting first was 227.
Also read: NZ vs BAN 3rd ODI: List of Commentators and Umpires for Today Match 2023
| City | Napier | ||
| Country | New Zealand | ||
| First ODI Match | 19/03/1983 | ||
| Last ODI Match | 13/02/2019 | ||
| Matches Played | 44 | ||
| Matches Won by Home Side | 25 (56.82%) | ||
| Matches Won by Touring Side | 14 (31.82%) | ||
| Matches Won by Neutral Side | 2 (4.55%) | ||
| Matches Won Batting First | 17 (36.17%) | ||
| Matches Won Batting Second | 24 (51.06%) | ||
| Matches Won Winning Toss | 22 (46.81%) | ||
| Matches Won Losing Toss | 19 (40.43%) | ||
| Matches Tied | 2 (4.55%) | ||
| Matches with No Result | 1 (2.27%) | ||
| Highest Individual Innings | 141* | R T Ponting (Australia) | 05/03/2005 v New Zealand |
| Best Bowling | 5/30 | M Muralitharan (Sri Lanka) | 31/01/2001 v New Zealand |
| Highest Team Innings | 373/8 (New Zealand) | 09/02/2012 v Zimbabwe | |
| Lowest Team Innings | 126 (Pakistan) | 14/01/2004 v New Zealand | |
| Highest Run Chase Achieved | 289/3 (Sri Lanka) | 28/12/2006 v New Zealand | |
| Average Runs per Wicket | 31.44 | ||
| Average Runs per Over | 5.01 | ||
| Average Score Batting First | 227 | ||

