NZ vs SA 2nd Test 2024: Seddon Park Pitch Report and Test Records & Stats
The second and final Test of the series between New Zealand and South Africa is scheduled to commence on Tuesday, February 13, at Seddon Park in Hamilton. With the Kiwis holding a 1-0 lead in the series, anticipation is high for the upcoming match. The initial Test at Bay Oval unfolded as a largely one-sided affair. New Zealand asserted dominance with a formidable total of 511, powered by Rachin Ravindra’s double-century (240) and Kane Williamson’s century (118). In response, South Africa faltered, managing only 162 runs and conceding a substantial first-innings lead of 349 to the hosts.
In the second innings, Williamson showcased his prowess once again by smashing a century as New Zealand declared their innings at 179/4, setting an imposing target of 529 runs for the Proteas. Displaying relentless determination, New Zealand’s bowlers then dismantled the visitors for 247 runs, securing a resounding victory by 281 runs and establishing an insurmountable lead in the two-match series. With a commanding performance in the opening Test, the inexperienced South African side faces the daunting task of elevating their game to match the Kiwis’ level and salvage the series. Meanwhile, New Zealand aims to maintain their dominance and achieve a whitewash in Hamilton.
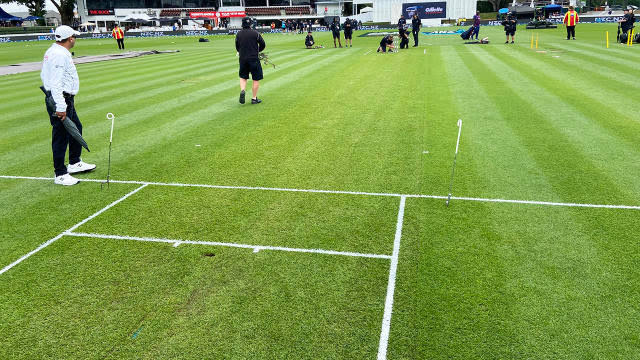
NZ vs SA 2nd Test 2024: Seddon Park Pitch Report Today Match
The pitch at Seddon Park is favorable to bowlers, particularly assisting seamers who are likely to capitalize on the surface’s early movement with the new ball. However, as the match progresses, the pitch is anticipated to ease up, providing better batting conditions. Consequently, spectators can anticipate an enthralling contest between bat and ball, with both teams vying for supremacy at the venue.
NZ vs SA 2nd Test 2024: Seddon Park Test Records & Stats
Seddon Park, located in Hamilton, New Zealand, has been the stage for 27 Test matches since its inaugural game on February 22, 1991, until the most recent encounter on December 3, 2020. With various names over the years, including Westpac Trust Park, Westpac Park, and Trust Bank Park, it has witnessed a range of cricketing battles. In these Tests, the home side has emerged victorious in 13 matches (48.15%), while the touring side has won 6 (22.22%). Notably, there have been 8 draws (29.63%), highlighting the competitive nature of matches at this venue.
Teams winning the toss have won 44.44% of the matches, while those losing the toss have won 25.93%. Matches won batting first account for 33.33%, while those won batting second make up 37.04%. Interestingly, there have been no victories for neutral sides.
The records at Seddon Park boast impressive individual and team performances. Kane Williamson holds the record for the highest individual innings, scoring 251 runs against West Indies on December 3, 2020. Chris Cairns’ outstanding bowling figures of 7/27 in an innings and 10/100 in a match, achieved against West Indies on December 16, 1999, stand as the best bowling performances at the venue.
New Zealand’s highest team innings of 715/6 declared was recorded on February 28, 2019, against Bangladesh, while their lowest team innings of 93 was against Pakistan on January 2, 1993. The highest successful run chase achieved at Seddon Park was 212/4 by Australia against New Zealand on March 31, 2000.
On average, the opening stand yields 35.33 runs, while the average runs per wicket is 31.88. Teams batting first at Seddon Park have posted an average score of 313 runs, showcasing the venue’s tendency to produce substantial totals. With a moderate average of 3.15 runs per over, Seddon Park offers a balanced platform for both batsmen and bowlers, ensuring thrilling contests for cricket enthusiasts.
Also read: AUS vs WI Head To Head T20 Records & Stats- Australia vs West Indies 3rd T20 Today Match 2024
| City | Hamilton | ||
| Country | New Zealand | ||
| Also or previously Known as | Westpac Trust Park, Westpac Park, Trust Bank Park | ||
| First Test Match | 22/02/1991 | ||
| Last Test Match | 03/12/2020 | ||
| Matches Played | 27 | ||
| Matches Won by Home Side | 13 (48.15%) | ||
| Matches Won by Touring Side | 6 (22.22%) | ||
| Matches Won by Neutral Side | 0 (0.00%) | ||
| Matches Won Batting First | 9 (33.33%) | ||
| Matches Won Batting Second | 10 (37.04%) | ||
| Matches Won Winning Toss | 12 (44.44%) | ||
| Matches Won Losing Toss | 7 (25.93%) | ||
| Matches Drawn | 8 (29.63%) | ||
| Matches Tied | 0 (0.00%) | ||
| Highest Individual Innings | 251 | K S Williamson (New Zealand) | 03/12/2020 v West Indies |
| Best Bowling (Innings) | 7/27 | C L Cairns (New Zealand) | 16/12/1999 v West Indies |
| Best Bowling (Match) | 10/100 | C L Cairns (New Zealand) | 16/12/1999 v West Indies |
| Highest Team Innings | 715/6 dec (New Zealand) | 28/02/2019 v Bangladesh | |
| Lowest Team Innings | 93 (New Zealand) | 02/01/1993 v Pakistan | |
| Highest Run Chase Achieved | 212/4 (Australia) | 31/03/2000 v New Zealand | |
| Average Opening Stand (Runs) | 35.33 | ||
| Average Runs per Wicket | 31.88 | ||
| Average Runs per Over | 3.15 | ||
| Average Score Batting First | 313 | ||

