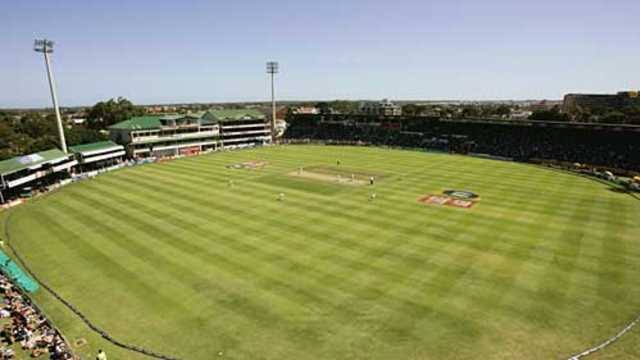
St George’s Oval T20 Records & Stats- India vs South Africa 2nd T20I 2023
St. George’s Oval, located in Port Elizabeth, South Africa, has been a venue for T20 cricket matches since December 16, 2007. Over the course of its T20 history until February 23, 2020, three matches have been played at this venue.
Out of these matches, the home side has been victorious in two instances, achieving a win percentage of 66.67%. On the contrary, the touring side secured a victory in one match (33.33%), and no matches were won by neutral sides. Teams batting first have won 50.00% of the matches, while those batting second secured victories in 25.00% of the games.
Remarkably, the side winning the toss emerged victorious in 75.00% of the matches, showcasing a notable advantage. There were no tied matches or instances with no result recorded during this period.
The highest individual innings at St. George’s Oval was scored by Quinton de Kock, reaching 70 runs against Australia on February 23, 2020. The best bowling performance was by Dale Steyn, who took 4/9 against West Indies on December 16, 2007.
The highest team innings recorded at this venue was 179/6 by South Africa against New Zealand on December 26, 2012. However, there is no information available on the lowest team innings.
The highest successful run chase was achieved by West Indies, scoring 60/5 against South Africa on December 16, 2007. On average, 19.66 runs are scored per wicket, and the average runs per over stand at 7.26. The average score when batting first is 99 runs.
Also read: Rahul Dravid to be Removed from India Head Coach Position? BCCI Did Not Finalise the Contract
| City | Port Elizabeth | ||
| Country | South Africa | ||
| Also or previously Known as | Crusaders Ground, Sahara Oval | ||
| First T20 Match | 16/12/2007 | ||
| Last T20 Match | 23/02/2020 | ||
| Matches Played | 3 | ||
| Matches Won by Home Side | 2 (66.67%) | ||
| Matches Won by Touring Side | 1 (33.33%) | ||
| Matches Won by Neutral Side | 0 (0.00%) | ||
| Matches Won Batting First | 2 (50.00%) | ||
| Matches Won Batting Second | 1 (25.00%) | ||
| Matches Won Winning Toss | 3 (75.00%) | ||
| Matches Won Losing Toss | 0 (0.00%) | ||
| Matches Tied | 0 (0.00%) | ||
| Matches with No Result | 0 (0.00%) | ||
| Highest Individual Innings | 70 | Q de Kock (South Africa) | 23/02/2020 v Australia |
| Best Bowling | 4/9 | D W Steyn (South Africa) | 16/12/2007 v West Indies |
| Highest Team Innings | 179/6 (South Africa) | 26/12/2012 v New Zealand | |
| Lowest Team Innings | No completed innings | ||
| Highest Run Chase Achieved | 60/5 (West Indies) | 16/12/2007 v South Africa | |
| Average Runs per Wicket | 19.66 | ||
| Average Runs per Over | 7.26 | ||
| Average Score Batting First | 99 | ||

