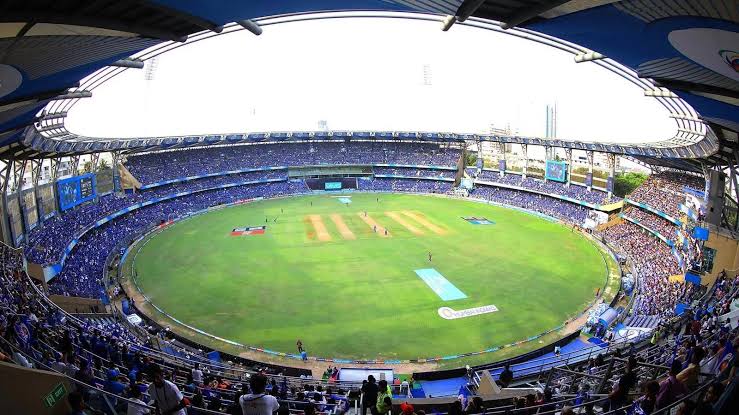
Wankhede Stadium ODI Records & Stats- England vs South Africa World Cup 2023
Mumbai, India, has hosted 23 One Day International (ODI) matches between January 17, 1987, and March 17, 2023. The home side won 11 matches, which accounts for 47.83% of the games, while the touring side secured victory in 9 matches (39.13%). Additionally, 3 matches were won by neutral teams (13.04%).
In terms of batting performances, 11 matches were won by teams batting first, and 12 matches were won by teams chasing. The same number of matches (11) were won by teams winning the toss and choosing to bat, while 12 matches were won by teams losing the toss and fielding first. There were no tied matches or matches with no result.
The highest individual innings in an ODI in Mumbai was an unbeaten 151 by S.T. Jayasuriya of Sri Lanka against India on May 17, 1997. The best bowling performance was by M. Kartik of India, who took 6 wickets for 27 runs against Australia on October 17, 2007.
The highest team innings was 438/4, achieved by South Africa on October 25, 2015, against India. In contrast, the lowest team total was 115 runs, recorded by Bangladesh on May 25, 1998, against India. The highest successful run chase was 284/4, accomplished by New Zealand on October 22, 2017, against India.
On average, teams scored 31.29 runs per wicket and 5.09 runs per over in Mumbai. The typical score when batting first was 245 runs.
These statistics provide insights into the performance and history of ODI cricket in Mumbai, showcasing a mix of successful batting and bowling feats, memorable matches, and a balanced distribution of victories between home and touring teams.
Also read: ENG vs SA, World Cup 2023: List of Commentators and Umpires for Today Match
| City | Mumbai | ||
| Country | India | ||
| First ODI Match | 17/01/1987 | ||
| Last ODI Match | 17/03/2023 | ||
| Matches Played | 23 | ||
| Matches Won by Home Side | 11 (47.83%) | ||
| Matches Won by Touring Side | 9 (39.13%) | ||
| Matches Won by Neutral Side | 3 (13.04%) | ||
| Matches Won Batting First | 11 (47.83%) | ||
| Matches Won Batting Second | 12 (52.17%) | ||
| Matches Won Winning Toss | 11 (47.83%) | ||
| Matches Won Losing Toss | 12 (52.17%) | ||
| Matches Tied | 0 (0.00%) | ||
| Matches with No Result | 0 (0.00%) | ||
| Highest Individual Innings | 151* | S T Jayasuriya (Sri Lanka) | 17/05/1997 v India |
| Best Bowling | 6/27 | M Kartik (India) | 17/10/2007 v Australia |
| Highest Team Innings | 438/4 (South Africa) | 25/10/2015 v India | |
| Lowest Team Innings | 115 (Bangladesh) | 25/05/1998 v India | |
| Highest Run Chase Achieved | 284/4 (New Zealand) | 22/10/2017 v India | |
| Average Runs per Wicket | 31.29 | ||
| Average Runs per Over | 5.09 | ||
| Average Score Batting First | 245 | ||

