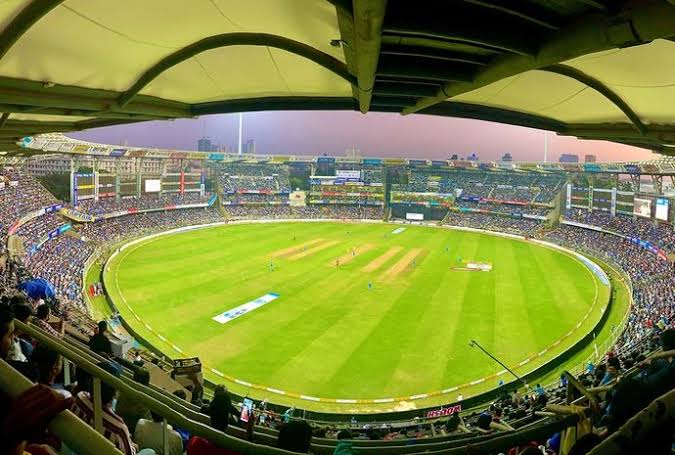
India Women is scheduled to face Australia Women at the Wankhede Stadium in Mumbai today in the first and only Test of their series.
Wankhede Stadium Test Records and Stats- INDW vs AUSW 1st Test Today Match 2023
Mumbai, a cricketing hub in India, has witnessed a cricketing history that spans several decades. The city has hosted a total of 26 Test matches, with the inaugural game taking place on 23/01/1975 and the most recent one concluding on 03/12/2021. In these contests, the home side emerged victorious in 12 matches, constituting 46.15% of the total, while the touring side secured triumph in 7 matches, equivalent to 26.92%. Notably, no matches concluded with a win for the neutral side.
The outcomes vary when analyzing batting performances, as the team batting first claimed victory in 11 matches (42.31%), while the team batting second triumphed in 8 matches (30.77%). The impact of winning the toss is evident, with teams winning after winning the toss constituting 46.15%, and those prevailing after losing the toss at 26.92%. Additionally, a considerable number of matches, 26.92%, ended in draws, highlighting the competitive nature of the contests.
Several cricketing milestones have been etched in Mumbai, with the highest individual innings being an impressive 242* by C H Lloyd from the West Indies on 23/01/1975 against India. The best bowling performance in an innings and a match, both credited to A Y Patel from New Zealand, occurred on 03/12/2021 against India, with figures of 10/119 and 14/225, respectively.
The record for the highest team innings belongs to India, scoring 631 on 08/12/2016 against England. In contrast, the lowest team innings stands at 62, a challenging day for New Zealand on 03/12/2021 against India. The highest successful run chase in Mumbai was achieved by South Africa, scoring 164/6 on 24/02/2000 against India.
Statistically, the average opening stand in Mumbai is 37.84 runs, and the average runs per wicket and per over are 29.60 and 2.92, respectively. The average score when batting first is 339, encapsulating the historical significance and competitive dynamics of Test cricket in Mumbai.
Also read: India vs South Africa Today Match Prediction: Who Will Win 3rd ODI of India tour of South Africa 2023?
| City | Mumbai | ||
| Country | India | ||
| First Test Match | 23/01/1975 | ||
| Last Test Match | 03/12/2021 | ||
| Matches Played | 26 | ||
| Matches Won by Home Side | 12 (46.15%) | ||
| Matches Won by Touring Side | 7 (26.92%) | ||
| Matches Won by Neutral Side | 0 (0.00%) | ||
| Matches Won Batting First | 11 (42.31%) | ||
| Matches Won Batting Second | 8 (30.77%) | ||
| Matches Won Winning Toss | 12 (46.15%) | ||
| Matches Won Losing Toss | 7 (26.92%) | ||
| Matches Drawn | 7 (26.92%) | ||
| Matches Tied | 0 (0.00%) | ||
| Highest Individual Innings | 242* | C H Lloyd (West Indies) | 23/01/1975 v India |
| Best Bowling (Innings) | 10/119 | A Y Patel (New Zealand) | 03/12/2021 v India |
| Best Bowling (Match) | 14/225 | A Y Patel (New Zealand) | 03/12/2021 v India |
| Highest Team Innings | 631 (India) | 08/12/2016 v England | |
| Lowest Team Innings | 62 (New Zealand) | 03/12/2021 v India | |
| Highest Run Chase Achieved | 164/6 (South Africa) | 24/02/2000 v India | |
| Average Opening Stand (Runs) | 37.84 | ||
| Average Runs per Wicket | 29.60 | ||
| Average Runs per Over | 2.92 | ||
| Average Score Batting First | 339 | ||

