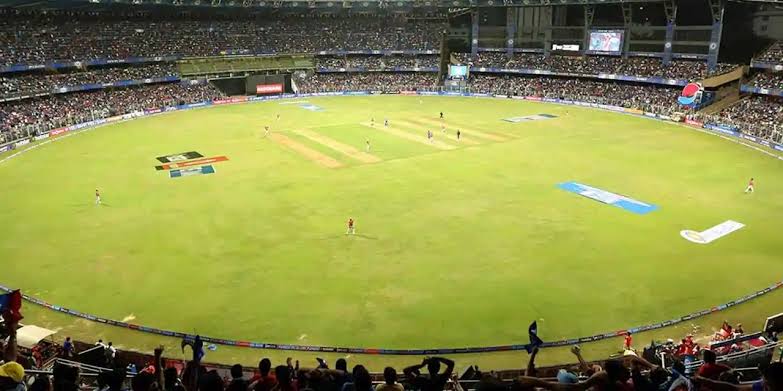
India Women will face England Women at the Wankhede Stadium in Mumbai today on December 9, 2023.
Wankhede Stadium T20 Records & Stats- India Women vs England Women 2nd T20I, England Tour of India 2023
Mumbai, India, has hosted eight T20 matches, with the last one played on 03/01/2023. The home side won three matches (37.50%), the touring side won two (25.00%), and three matches were won by the neutral side (37.50%). Batting second proved successful in five matches (62.50%), while batting first resulted in victory for three matches (37.50%).
The team winning the toss won six matches (75.00%), and the losing toss team won two matches (25.00%). There were no tied or no-result matches. The highest individual innings was 100* by C H Gayle (West Indies) on 16/03/2016, and the best bowling performance was 4/22 by Shivam Mavi (India) on 03/01/2023.
The highest team innings was 240/3 by India on 11/12/2019, while the lowest team innings was 160 by Sri Lanka on 03/01/2023. The highest run chase achieved was 230/8 by England on 18/03/2016. The average runs per wicket stand at 32.17, and the average runs per over is 9.34. The average score when batting first is 191.
Also read: Zimbabwe vs Ireland T20 Head to Head Records and Stats- ZIM vs IRE 2nd T20I 2023
| City | Mumbai | ||
| Country | India | ||
| First T20 Match | 22/12/2012 | ||
| Last T20 Match | 03/01/2023 | ||
| Matches Played | 8 | ||
| Matches Won by Home Side | 3 (37.50%) | ||
| Matches Won by Touring Side | 2 (25.00%) | ||
| Matches Won by Neutral Side | 3 (37.50%) | ||
| Matches Won Batting First | 3 (37.50%) | ||
| Matches Won Batting Second | 5 (62.50%) | ||
| Matches Won Winning Toss | 6 (75.00%) | ||
| Matches Won Losing Toss | 2 (25.00%) | ||
| Matches Tied | 0 (0.00%) | ||
| Matches with No Result | 0 (0.00%) | ||
| Highest Individual Innings | 100* | C H Gayle (West Indies) | 16/03/2016 v England |
| Best Bowling | 4/22 | Shivam Mavi (India) | 03/01/2023 v Sri Lanka |
| Highest Team Innings | 240/3 (India) | 11/12/2019 v West Indies | |
| Lowest Team Innings | 160 (Sri Lanka) | 03/01/2023 v India | |
| Highest Run Chase Achieved | 230/8 (England) | 18/03/2016 v South Africa | |
| Average Runs per Wicket | 32.17 | ||
| Average Runs per Over | 9.34 | ||
| Average Score Batting First | 191 | ||

